Call CA Tally HelpDesk
+91 9205471661,
7428779101
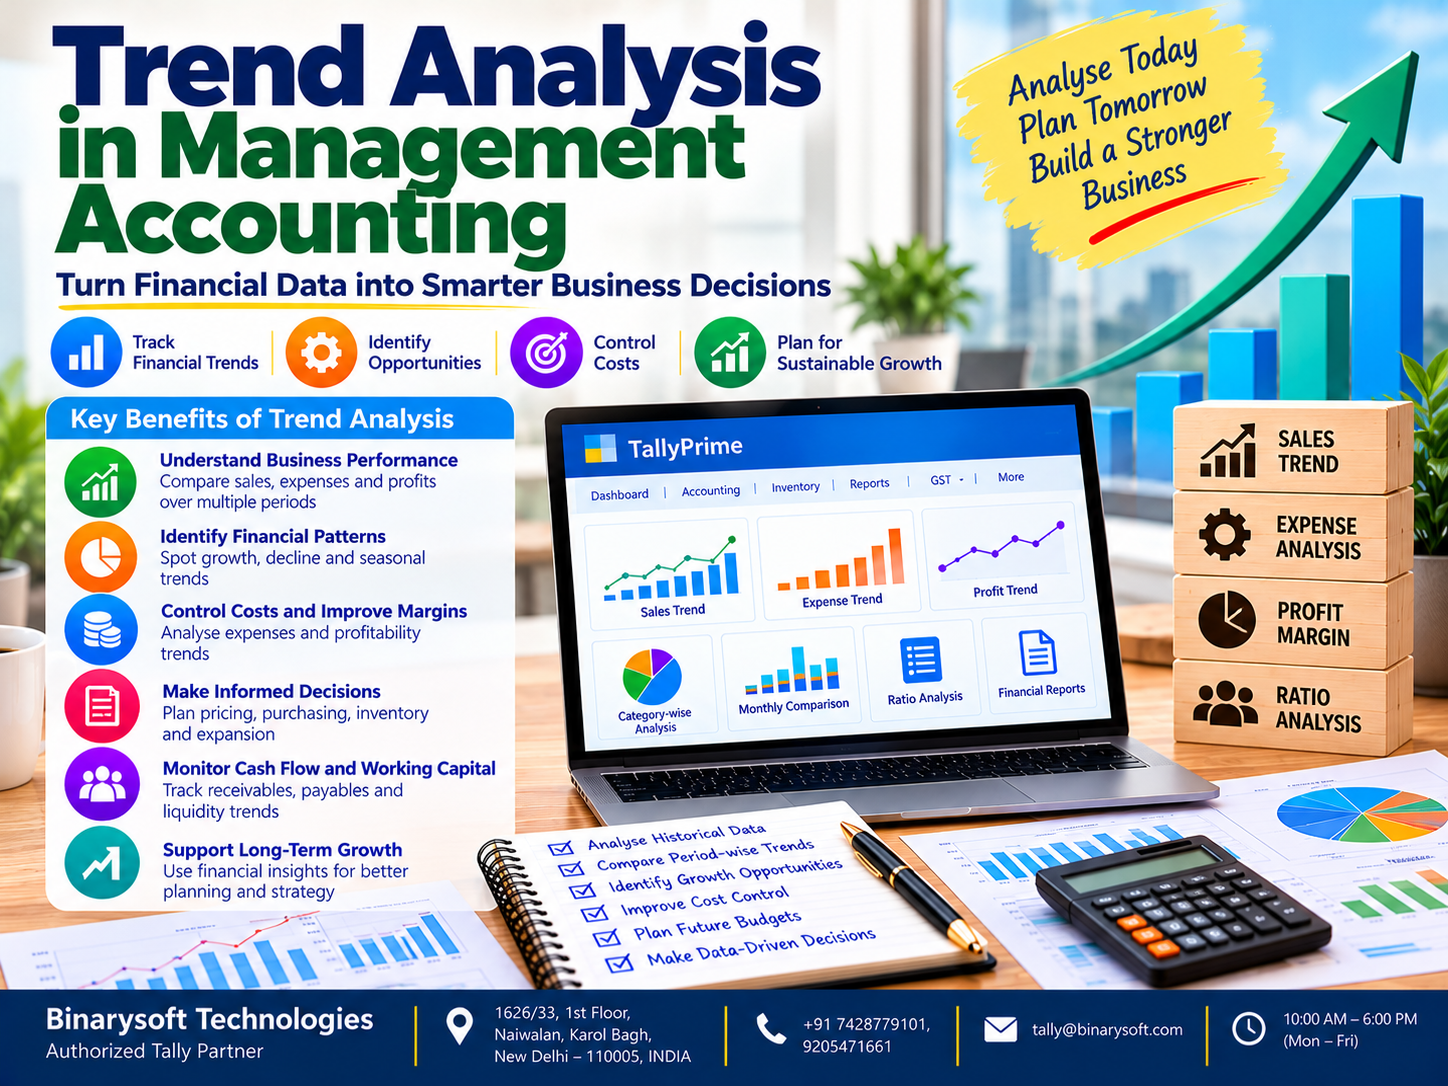
Introduction: Why Understanding Financial Trends Is Essential for Business Success
Every business generates financial information through sales, purchases, expenses, customer payments and inventory transactions.
However, recording financial transactions is only the beginning of effective business management.
The real value of accounting information emerges when businesses analyze how their financial performance changes over time.
A company may report increasing sales while its profit margin continues to decline.
Another business may experience a temporary reduction in revenue because of seasonal demand rather than operational problems.
Without examining historical patterns, management may misunderstand these situations.
This is where trend analysis in management accounting becomes important.
Trend analysis helps businesses compare financial information across months, quarters or years to identify patterns, changes and potential risks.
It supports better decisions about pricing, purchasing, inventory, expenses and business expansion.
For Indian businesses, accounting software such as TallyPrime provides financial reports and historical transaction information that can support meaningful trend analysis.
This guide explains the meaning, methods, formulas and benefits of trend analysis, with practical examples, two illustrative case studies and guidance on using TallyPrime.
1. What Is Trend Analysis in Management Accounting?
Trend analysis is a management accounting technique used to examine changes in financial and operational information over multiple periods.
It helps identify whether business performance is improving, declining or remaining relatively stable.
Management may analyze trends in:
-
Sales revenue and sales quantities.
-
Gross profit and net profit.
-
Raw material and operating expenses.
-
Customer receivables and supplier payables.
-
Inventory levels and stock turnover.
-
Cash flow and working capital.
-
Financial ratios and departmental performance.
For example, a company reporting annual revenue of ₹50 lakh may appear successful.
However, if its revenue was ₹60 lakh in the previous year, management should investigate the decline.
Trend analysis provides the historical context required to interpret current performance.
2. An Emotional Story: The Business Owner Who Almost Closed His Factory
For sixteen years, Arvind operated a small garment manufacturing business in Delhi.
He started with five sewing machines and gradually expanded into supplying clothing to retailers.
His factory employed workers who depended on regular salaries.
Arvind considered his business successful because customer orders arrived consistently.
However, during one financial year, his profits began declining.
Despite maintaining reasonable sales, his bank balance was shrinking.
Supplier payments became difficult, and employees started worrying about salary delays.
One evening, Arvind sat alone in his factory office.
He looked at the machines that had supported his family for years.
He wondered whether the business was slowly failing.
His accountant suggested examining financial information from previous years rather than focusing only on the current month's results.
Together, they reviewed sales, raw material costs, operating expenses and customer outstanding balances.
The trend analysis revealed something important.
Sales had increased gradually, but material costs were growing much faster.
Customer collection periods had also become longer.
The business was not necessarily suffering from weak demand.
Its profitability and liquidity were being affected by rising costs and delayed collections.
Using organized financial information from TallyPrime, the team began reviewing purchasing costs, customer outstanding balances and monthly profit trends.
Arvind renegotiated selected supplier arrangements, improved inventory planning and introduced more consistent payment follow-ups.
The improvements required patience.
However, he gradually regained confidence in his financial decisions.
One evening, after reviewing a monthly performance report, he realized that understanding financial trends had helped him recognize problems before they became irreversible.
For Arvind, trend analysis was more than an accounting technique. It became a way to protect his employees, his family's future and the business he had spent years building.
This is an illustrative story created to explain the importance of financial trend analysis.
3. Why Is Trend Analysis Important for Businesses?
Identifying Financial Problems Early
A continuous increase in operating expenses may indicate inefficiencies requiring management attention.
Understanding Revenue Growth
Businesses can distinguish sustained sales growth from temporary increases.
Improving Profitability
Comparing profit margins across periods helps identify changing cost structures.
Supporting Financial Planning
Historical trends provide useful inputs for budgets and forecasts.
Improving Inventory Decisions
Stock movement trends can help businesses identify seasonal demand and slow-moving inventory.
Strengthening Cash Flow Management
Receivables and payables trends help management understand liquidity pressure.
Evaluating Business Strategies
Management can compare financial performance before and after operational changes.
4. Major Types of Trend Analysis in Management Accounting
Businesses use different analytical methods depending on their objectives.
4.1 Horizontal Analysis
Horizontal analysis compares financial information across accounting periods.
It identifies changes in monetary amounts and percentages.
Percentage Change = (Current Period Value − Previous Period Value) ÷ Previous Period Value × 100
Example
| Financial Year | Sales Revenue | Annual Growth |
|---|
| 2023–24 |
₹40,00,000 |
— |
| 2024–25 |
₹46,00,000 |
15% |
| 2025–26 |
₹52,90,000 |
15% |
The business achieved 15% sales growth in each successive year.
However, management should also examine whether profit increased at a similar rate.
4.2 Vertical Analysis
Vertical analysis expresses financial statement items as percentages of a common base.
In a Profit & Loss statement, revenue is commonly used as the base.
Example
| Particulars | Amount | Percentage of Revenue |
|---|
| Sales Revenue |
₹50,00,000 |
100% |
| Cost of Goods Sold |
₹30,00,000 |
60% |
| Gross Profit |
₹20,00,000 |
40% |
| Operating Expenses |
₹12,00,000 |
24% |
| Operating Profit |
₹8,00,000 |
16% |
Comparing these percentages across periods helps identify changes in profitability and operating efficiency.
4.3 Ratio Trend Analysis
Ratio trend analysis examines changes in financial ratios over time.
Common ratios include:
Gross Profit Margin = Gross Profit ÷ Revenue × 100
Net Profit Margin = Net Profit ÷ Revenue × 100
Current Ratio = Current Assets ÷ Current Liabilities
Inventory Turnover = Cost of Goods Sold ÷ Average Inventory
Tracking these ratios over multiple periods provides more context than reviewing a single year's results.
4.4 Base-Year Trend Analysis
Base-year analysis compares financial values with a selected reference year.
Trend Percentage = Current Period Value ÷ Base Period Value × 100
Example
| Year | Revenue | Trend Percentage |
|---|
| 2023 |
₹20 lakh |
100% |
| 2024 |
₹24 lakh |
120% |
| 2025 |
₹27 lakh |
135% |
| 2026 |
₹30 lakh |
150% |
Revenue in 2026 is 50% higher than in the base year.
This does not necessarily mean that profit or sales volume increased by the same percentage.
4.5 Regression-Based Trend Analysis
Regression analysis uses mathematical relationships to estimate trends from historical data.
For example, a business may use monthly sales information to estimate an underlying growth pattern.
Regression can support forecasting, but its reliability depends on data quality, the model selected and whether historical relationships remain relevant.
Businesses may use spreadsheets or specialized analytical software for these calculations.
5. Trend Analysis vs Financial Statement Analysis
| Basis | Trend Analysis | Financial Statement Analysis |
|---|
| Main Objective |
Identify changes over time |
Evaluate financial performance and position |
| Time Period |
Multiple periods |
One or multiple periods |
| Common Methods |
Growth rates, base-year indices, trends |
Ratios, comparisons and financial interpretation |
| Main Focus |
Direction and patterns |
Financial health and performance |
| Business Application |
Forecasting and early warning |
Financial evaluation and decision-making |
Trend analysis is an important component of broader financial statement analysis.
6. Step-by-Step Process for Conducting Trend Analysis
Step 1: Define the Objective
Identify the business question.
For example, management may want to understand why profit margins are declining.
Step 2: Select the Reporting Period
Choose monthly, quarterly or annual information according to the business requirement.
Step 3: Collect Financial Data
Gather comparable sales, expense, inventory and financial statement information.
Step 4: Verify Data Consistency
Check whether accounting policies and classifications are comparable across periods.
Step 5: Calculate Changes
Determine absolute changes, percentage changes and relevant financial ratios.
Step 6: Identify Patterns
Look for sustained increases, declines, seasonal movements and unusual fluctuations.
Step 7: Investigate Causes
Examine pricing, customer demand, purchasing costs and operational changes.
Step 8: Take Corrective Action
Use the findings to improve purchasing, pricing, collections or operational planning.
Step 9: Monitor Results
Review subsequent periods to determine whether the changes produced the intended results.
7. Sales Trend Analysis: Understanding Revenue Performance
Sales trend analysis helps businesses evaluate changes in revenue over time.
It can identify:
-
Consistent revenue growth.
-
Seasonal sales patterns.
-
Declining product demand.
-
Changes in customer purchasing behavior.
-
Differences between product categories.
Practical Example
A retailer records the following quarterly revenue:
| Quarter | Revenue |
|---|
| Q1 |
₹12 lakh |
| Q2 |
₹15 lakh |
| Q3 |
₹14 lakh |
| Q4 |
₹19 lakh |
Revenue increases significantly in Q4.
However, management should investigate whether the increase reflects seasonal demand, promotional activity or a sustainable improvement.
A single strong quarter does not guarantee continued growth.
8. Expense Trend Analysis: Controlling Rising Business Costs
Expense trend analysis examines changes in operating expenditure.
Businesses can monitor raw materials, salaries, rent, transportation and administrative costs.
Example
Suppose annual revenue increases by 10%, but transportation expenses increase by 25%.
This difference deserves investigation.
Possible reasons include higher fuel prices, inefficient delivery routes, increased shipment frequency or changes in customer locations.
Management should distinguish between unavoidable market-related increases and controllable operational costs.
9. Profitability Trend Analysis
Profitability analysis examines whether increasing sales are producing stronger earnings.
Example
| Year | Revenue | Net Profit | Net Profit Margin |
|---|
| 2024 |
₹50 lakh |
₹5 lakh |
10% |
| 2025 |
₹60 lakh |
₹5.4 lakh |
9% |
| 2026 |
₹70 lakh |
₹5.6 lakh |
8% |
Revenue increases each year, but the net profit margin declines.
This indicates that expenses are consuming a larger proportion of revenue.
Management should review pricing, purchasing costs and operating efficiency.
Higher revenue does not automatically mean better profitability.
10. How TallyPrime Helps with Financial Trend Analysis
TallyPrime provides financial reports and accounting information that support period-wise comparisons.
Profit & Loss Reporting
Businesses can examine revenue, expenses and profitability across selected reporting periods.
Balance Sheet Analysis
Management can review changes in assets, liabilities and financial position.
Sales and Purchase Registers
Historical transactions help identify sales and purchasing patterns.
Ratio Analysis
Relevant ratios support liquidity, profitability and financial performance evaluation.
Cash Flow Reporting
Cash flow information helps businesses review liquidity movements.
Inventory Reporting
Stock reports support analysis of quantities, valuations and relevant inventory movement.
Dashboard
The TallyPrime Dashboard can display selected business information and charts, depending on configuration.
Period Comparisons
Available report configurations and column features can help users compare financial information across periods.
Data Export
Businesses can export relevant reports for advanced analysis, forecasting and graphical presentation.
TallyPrime supports the underlying data collection and reporting process.
More advanced statistical forecasting may require separate analytical tools.
11. Step-by-Step: Performing Trend Analysis Using TallyPrime
Step 1: Open the relevant company in TallyPrime.
Step 2: Review the Profit & Loss report for the selected financial period.
Step 3: Compare revenue and expenses with previous periods using suitable report configurations.
Step 4: Examine sales registers to identify changes in turnover.
Step 5: Review purchase records to understand changes in procurement costs.
Step 6: Analyze customer outstanding balances and collection patterns.
Step 7: Review inventory reports for stock-related trends.
Step 8: Examine relevant financial ratios.
Step 9: Export selected reports when additional calculations or charts are required.
Step 10: Prepare a management summary identifying important changes, possible causes and recommended actions.
Regular analysis helps businesses convert accounting information into practical management decisions.
12. Case Study 1: Manufacturing Company Identifies Declining Profit Margins
Business Background
A manufacturing company produced plastic packaging materials for commercial customers.
Annual revenue was increasing, but management noticed declining profitability.
Challenge
The company had not systematically compared raw material expenses with sales growth.
Solution Using TallyPrime
The finance team reviewed historical sales, purchases and expense reports.
Management calculated annual gross profit margins and examined changes in material costs.
Illustrative Results
Suppose the gross profit margin declined from 32% to 26% over three years.
Further analysis identified higher material purchase prices and increased production wastage as potential contributors.
Management reviewed supplier quotations and introduced more consistent material monitoring.
Key Learning
Trend analysis helps manufacturers recognize cost pressures that may remain hidden behind increasing sales.
This is an illustrative case study, not a documented customer implementation.
13. Case Study 2: Wholesale Distributor Improves Inventory Planning
Business Background
A wholesale distributor supplied electrical products to retailers.
The business maintained substantial inventory throughout the year.
Challenge
Management experienced stock shortages during peak demand and excess inventory during slower months.
Solution Using TallyPrime
The company reviewed historical sales and inventory information.
Monthly demand patterns were compared across multiple periods.
Management used these findings to prepare more realistic purchasing plans.
Illustrative Results
Suppose one product category consistently experienced higher demand during the final quarter.
The company adjusted its purchasing schedule to prepare for the expected seasonal increase.
It also reviewed slow-moving products to reduce unnecessary inventory accumulation.
Key Learning
Historical sales and inventory trends can support more efficient stock planning.
This is an illustrative case study intended to demonstrate potential business benefits.
14. Trend Analysis for Cash Flow and Working Capital
A profitable business can still experience financial difficulties when cash collections are delayed.
Trend analysis helps management examine:
-
Customer collection periods.
-
Supplier payment obligations.
-
Inventory holding periods.
-
Operating cash movements.
-
Short-term financing requirements.
For example, if average customer collection time increases from 35 days to 60 days, more money may remain tied up in receivables.
Management can investigate customer credit policies and payment follow-up procedures.
Regular working capital analysis helps businesses anticipate potential liquidity pressure.
15. Common Mistakes in Trend Analysis
Comparing Inconsistent Data
Changes in accounting policies or classifications may distort comparisons.
Ignoring Inflation
Revenue growth may partly reflect price increases rather than higher sales quantities.
Overlooking Seasonal Demand
A normal seasonal decline may be mistaken for deteriorating performance.
Using Too Few Periods
Short datasets may not provide reliable evidence of sustained trends.
Ignoring One-Time Transactions
Asset sales or unusual expenses can distort financial performance.
Focusing Only on Revenue
Increasing sales may conceal declining margins.
Assuming Trends Will Continue
Historical patterns do not guarantee future outcomes.
Failing to Investigate Causes
Trend calculations become less useful when management does not understand the reasons behind changes.
16. Limitations of Trend Analysis in Management Accounting
Trend analysis is valuable, but it has limitations.
Historical information may not accurately predict future conditions.
Unexpected economic changes, new competitors and regulatory developments can disrupt established patterns.
Data quality also affects the reliability of results.
A company may report increasing revenue because of inflation rather than improved sales volume.
Similarly, accounting policy changes can create differences that do not reflect actual operational performance.
Businesses should therefore combine trend analysis with budgets, operational information and management judgment.
17. Best Practices for Effective Financial Trend Analysis
Review financial information regularly. Monthly or quarterly analysis helps identify changes earlier.
Maintain consistent accounting records. Comparable data improves reliability.
Monitor multiple indicators. Review revenue, expenses, margins and cash flow together.
Separate recurring and exceptional items. Avoid misleading comparisons.
Consider seasonal patterns. Compare relevant periods across different years.
Use appropriate financial ratios. Ratios help explain changes in performance.
Investigate unusual fluctuations. Identify the operational reasons behind significant movements.
Prepare realistic forecasts. Use historical information alongside current business conditions.
Document management actions. Record decisions taken in response to identified trends.
Review results periodically. Evaluate whether corrective measures are effective.
These practices make trend analysis more useful for financial planning.
18. How Trend Analysis Supports Business Growth
Trend analysis helps businesses move from reactive financial management toward informed planning.
It can identify opportunities to improve product pricing, reduce unnecessary expenditure and strengthen customer collections.
Businesses can also use historical demand patterns to plan inventory and staffing requirements.
For growing organizations, trend analysis helps management evaluate whether expansion is supported by sustainable financial performance.
However, growth decisions should consider market conditions, investment requirements and cash flow projections.
Trend analysis provides evidence for decision-making rather than certainty about future results.
19. How Binarysoft Technologies Helps Businesses Use TallyPrime
Binarysoft Technologies, an Authorized Tally Partner, helps businesses explore TallyPrime solutions for accounting, inventory and financial reporting.
Accounting Configuration
Assistance with company setup, ledgers and accounting records.
Sales and Purchase Management
Guidance on maintaining organized transaction information.
Financial Reporting
Understanding Profit & Loss, Balance Sheet and relevant financial reports.
Inventory Management
Exploring stock records and inventory reporting capabilities.
Receivables and Payables
Reviewing customer and supplier outstanding information.
Cost-Centre Accounting
Using cost centres for suitable departmental or activity-wise analysis.
TallyPrime Cloud
Exploring appropriate hosted arrangements for authorized remote accounting access.
Financial Data Management
Understanding reporting, data export and backup practices.
Well-maintained accounting records provide a stronger foundation for trend analysis and business planning.
20. Conclusion: Trend Analysis Helps Businesses Turn Financial History into Better Decisions
Trend analysis in management accounting is an important technique for understanding business performance.
It helps organizations examine changes in sales, expenses, profitability, inventory and cash flow across multiple periods.
Methods such as horizontal analysis, vertical analysis, ratio trend analysis and base-year comparisons provide different perspectives on financial performance.
For manufacturers, trend analysis can reveal rising production costs.
For retailers, it can identify seasonal demand patterns.
For wholesalers, it can support inventory planning and customer credit management.
TallyPrime supports trend analysis by providing organized accounting records, financial reports, ratio information and relevant period-wise comparisons.
These capabilities help businesses review financial performance and identify areas requiring attention.
However, financial trends should always be interpreted alongside operational information, market conditions and professional judgment.
Ultimately, trend analysis is not simply about comparing numbers.
It is about understanding what those numbers reveal and using that knowledge to make better decisions.
Businesses that monitor financial trends consistently are better positioned to control costs, protect profitability, manage risks and pursue sustainable growth.
Powered by Binarysoft Technologies
Authorized Tally Partner
Location: 1626/33, 1st Floor, Naiwalan, Karol Bagh, New Delhi – 110005, INDIA
Contact Us: +91 7428779101, 9205471661
Email Us: tally@binarysoft.com
Business Hours: 10:00 AM – 6:00 PM, Monday to Friday
Frequently Asked Questions
What are the limitations of trend analysis?
Limitations include dependence on historical data, changing market conditions and inconsistent accounting information.
How is trend analysis different from ratio analysis?
Ratio analysis calculates relationships between financial figures, while trend analysis examines changes in figures or ratios over time.
How can Binarysoft Technologies help businesses?
Binarysoft Technologies can assist businesses with TallyPrime accounting, inventory, financial reporting, configuration and suitable cloud hosting arrangements.
Can small businesses use trend analysis?
Yes. Small businesses can use historical accounting information to identify financial patterns and improve planning.
CA. Raghav Mundhra focuses on business accounting, GST reporting, and financial reconciliations. He works with organizations to strengthen accounting processes and maintain reliable financial information for compliance and decision-making.