Call CA Tally HelpDesk
+91 9205471661,
7428779101
Introduction: Why Managing Every Inventory Item Equally Can Hurt Your Business
Inventory management is one of the most important responsibilities for any business dealing with physical products. Whether you operate a wholesale distribution company, manufacturing unit, retail store or e-commerce business, maintaining the right inventory balance directly affects profitability, cash flow and customer satisfaction.
However, one common mistake businesses make is treating every inventory item with equal importance.
Imagine a company maintaining 2,000 different products. Some items contribute significantly to annual sales and inventory consumption value, while others generate relatively little financial activity.
If the business spends equal time, money and resources managing every product, it may waste valuable working capital while neglecting its most important inventory.
This is where ABC Analysis in Inventory Management becomes extremely useful.
ABC analysis is a systematic inventory classification technique that divides products into three categories based on their relative financial importance.
By identifying high-value, medium-value and low-value inventory, businesses can prioritise stock monitoring, improve purchasing decisions and reduce unnecessary inventory expenses.
Modern accounting and inventory software such as Tally Prime helps businesses maintain stock records, analyse inventory movements and generate reports that support ABC classification.
In this comprehensive guide, we will explore ABC analysis, its formula, calculation methods, advantages, limitations, real-world applications and practical implementation using Tally Prime.
What Is ABC Analysis in Inventory Management?
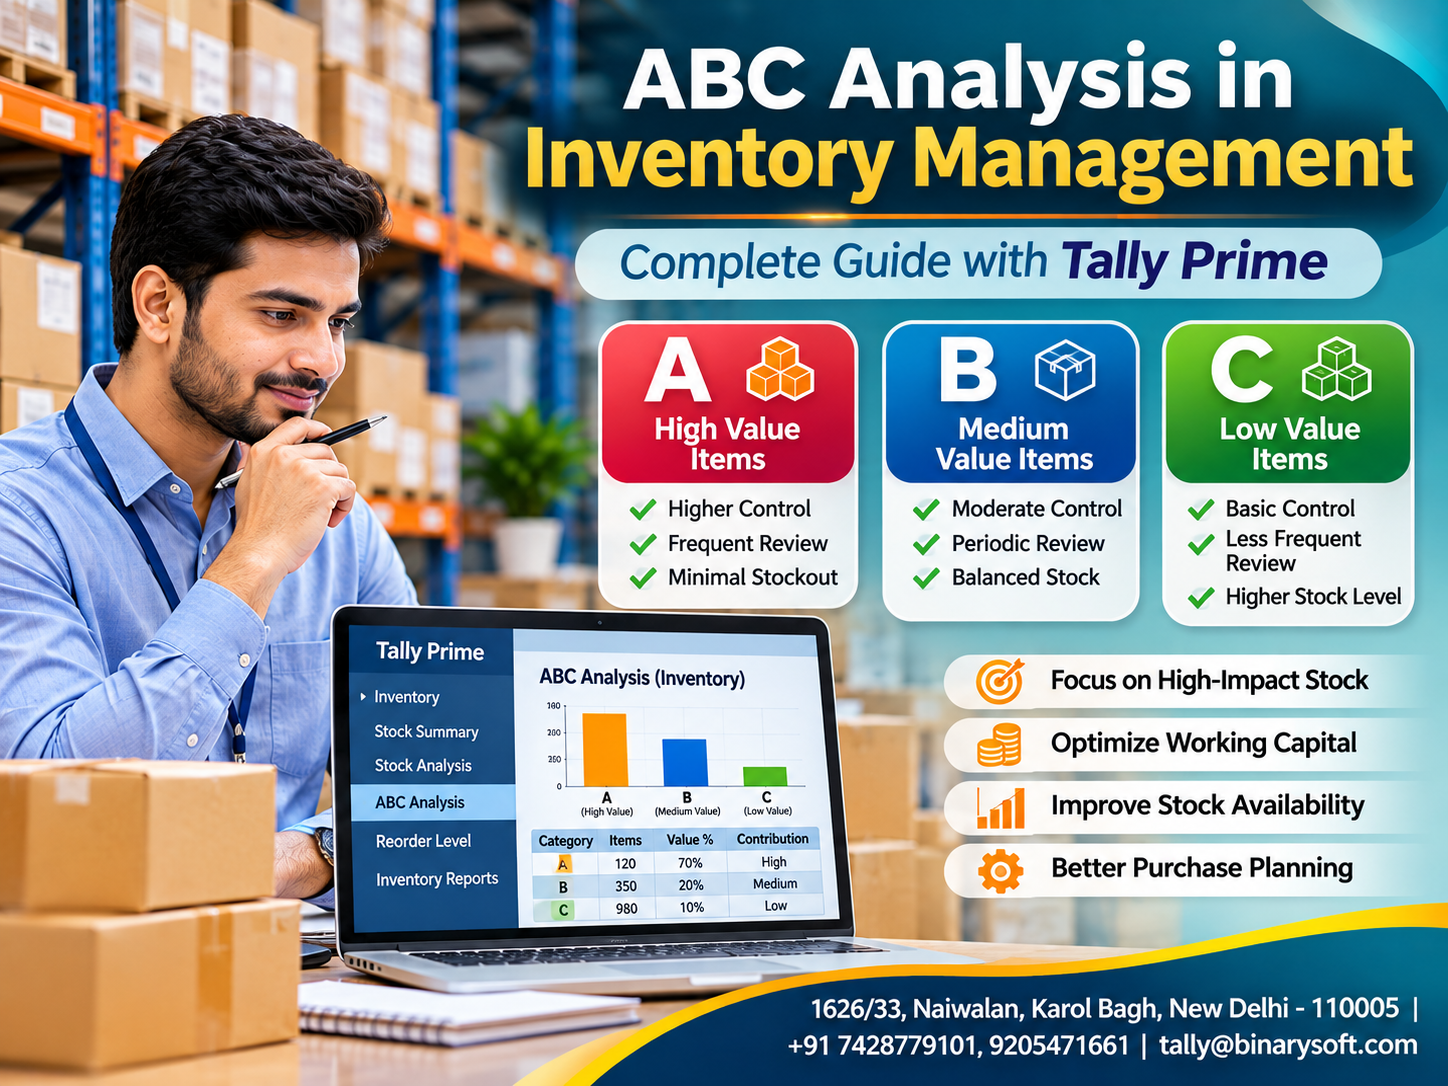
ABC analysis is an inventory management technique that classifies stock items into three groups—A, B and C—according to their contribution to total annual inventory consumption value.
The method follows the Pareto principle, commonly called the 80/20 rule.
This principle suggests that a relatively small percentage of inventory items may account for a large proportion of total inventory consumption value.
For example, approximately 20% of products might represent 80% of annual consumption value.
However, these percentages are guidelines rather than fixed rules. Actual distribution varies across industries and businesses.
The primary objective of ABC analysis is to help organisations focus their resources on inventory items with the greatest financial impact.
Understanding the Three Categories of ABC Analysis
A
High value
Category A: High-Value Inventory
Category A typically contains 10–20% of inventory items representing approximately 70–80% of annual consumption value. These products require close monitoring, accurate forecasting, frequent stock verification and strict purchasing controls.
B
Medium value
Category B: Medium-Value Inventory
Category B often contains 20–30% of stock items contributing approximately 15–25% of annual consumption value. These products require balanced monitoring, periodic verification and regular replenishment planning.
C
Low value
Category C: Low-Value Inventory
Category C may contain 50–70% of inventory items contributing only 5–10% of annual consumption value. These products can generally be managed with simpler procedures and less frequent reviews, provided their operational importance is also considered.
The Emotional Story: How Better Inventory Decisions Saved a Family Business
A Small Business Owner's Struggle With Unsold Inventory
For more than fifteen years, Amit operated an electrical equipment distribution business in Delhi.
The company had been established by his father, who believed that maintaining a large inventory was necessary to keep customers satisfied.
Following this tradition, Amit purchased almost every product in substantial quantities.
His warehouse was always full, but his bank balance told a different story.
Every month, supplier payments increased while customer collections remained unpredictable.
One evening, Amit received a call from an important customer requesting industrial electrical components.
Unfortunately, the required items were unavailable.
The customer cancelled the order and approached another distributor.
That night, Amit walked through his warehouse and noticed hundreds of cartons containing products that had remained untouched for months.
He realised that his business was not suffering from a lack of inventory.
It was suffering from poor inventory prioritisation.
After consulting an accounting professional, Amit introduced ABC inventory classification.
He discovered that a small group of products contributed most of his annual inventory consumption value.
He began monitoring these products closely, reduced unnecessary purchases of low-priority goods and reviewed stock movements through Tally Prime.
Over time, purchasing became more disciplined and essential products were available more consistently.
The most emotional moment came when Amit's father visited the warehouse.
Instead of seeing overcrowded shelves, he saw organised inventory and a business operating with greater confidence.
Amit understood that successful inventory management was not about storing more products.
It was about investing in the right products.
This fictional story illustrates common inventory challenges faced by growing Indian businesses.
ABC Analysis Formula and Calculation
The most commonly used ABC analysis method is based on annual consumption value.
Annual Consumption Value = Annual Quantity Consumed × Unit Cost
For example, if a company consumes 1,000 units of a product annually and each unit costs ₹500:
Annual Consumption Value = 1,000 × ₹500 = ₹5,00,000.
Businesses calculate this value for every inventory item and arrange products in descending order.
The percentage contribution is calculated as:
\[ \text{Value Contribution (\%)}=\frac{\text{Item Annual Consumption Value}}{\text{Total Annual Consumption Value}}\times100 \]
The cumulative contribution is then used to classify items into A, B and C categories.
Practical Example of ABC Analysis
Consider an electrical distribution company managing the following products.
|
Product
|
Annual consumption value
|
|---|
|
Industrial Motors
|
₹8,00,000
|
|
Copper Cables
|
₹6,00,000
|
|
Circuit Breakers
|
₹3,00,000
|
|
Electrical Switches
|
₹1,50,000
|
|
LED Components
|
₹70,000
|
|
Connectors
|
₹40,000
|
|
Insulation Tape
|
₹25,000
|
|
Cable Clips
|
₹15,000
|
|
Total
|
₹20,00,000
|
The first two products account for 70% of total annual consumption value.
Adding circuit breakers increases cumulative contribution to 85%.
The remaining products contribute the final 15%.
An illustrative classification would be:
-
Category A: Industrial Motors and Copper Cables — 70%.
-
Category B: Circuit Breakers and Electrical Switches — 22.5%.
-
Category C: Remaining four products — 7.5%.
These boundaries are illustrative. Companies should establish thresholds appropriate to their own inventory and business risks.
Interactive ABC Inventory Calculator
Change the category thresholds to see how the example products are classified.
Category B cumulative threshold
93%
Classification uses cumulative value before each item, so a product that crosses a threshold remains in the higher-priority category.
|
Product
|
Cumulative
|
Class
|
|
Industrial Motors
|
40.00%
|
A
|
|
Copper Cables
|
70.00%
|
A
|
|
Circuit Breakers
|
85.00%
|
B
|
|
Electrical Switches
|
92.50%
|
B
|
|
LED Components
|
96.00%
|
B
|
|
Connectors
|
98.00%
|
C
|
|
Insulation Tape
|
99.25%
|
C
|
|
Cable Clips
|
100.00%
|
C
|
Copy classification as CSV
Step-by-Step Process to Implement ABC Analysis
Step 1: Prepare a Complete Inventory List
Create a detailed list of all stock items, including product names, stock codes, quantities consumed and unit costs.
Ensure that duplicate items and incorrect product classifications are corrected.
Step 2: Calculate Annual Consumption Value
Multiply the annual consumption quantity of each product by its unit cost.
Use a consistent valuation basis across all products.
Step 3: Arrange Products by Value
Sort inventory items from highest to lowest annual consumption value.
This helps identify the products contributing most to inventory expenditure.
Step 4: Calculate Cumulative Percentages
Calculate each product's percentage contribution and cumulative contribution to total annual inventory consumption value.
Step 5: Assign ABC Categories
Define appropriate thresholds and classify inventory into A, B and C groups.
Step 6: Establish Inventory Policies
Apply strict monitoring to Category A, moderate controls to Category B and simplified procedures to Category C.
Step 7: Review Classification Periodically
Product demand, costs and supplier conditions change over time.
Review ABC classifications quarterly, half-yearly or whenever major business changes occur.
Benefits of ABC Analysis in Inventory Management
Better Working Capital Management
ABC analysis helps businesses identify products requiring the greatest financial attention.
This reduces unnecessary investment in less important inventory.
Reduced Inventory Holding Costs
By prioritising stock purchases, businesses can reduce avoidable warehousing, insurance, handling and storage expenses.
Improved Stock Availability
High-priority products receive closer monitoring, helping reduce shortages of financially important items.
More Accurate Purchasing Decisions
Purchasing teams can establish category-specific reorder policies instead of ordering every product using the same approach.
Better Supplier Management
Businesses can focus negotiations, lead-time reviews and supply continuity planning on strategically important products.
Increased Operational Efficiency
Warehouse teams can allocate counting and monitoring resources according to product importance.
How Tally Prime Helps With ABC Analysis in Inventory Management
Tally Prime provides inventory records and reporting tools that businesses can use to perform ABC analysis and improve stock control.
1. Stock Summary Report
The Stock Summary report provides item-wise stock quantities and values.
Businesses can review stock balances and export inventory information for further analysis.
To access the report, open Tally Prime, press Alt+G, search for Stock Summary and select the required reporting period.
2. Stock Item and Stock Group Management
Tally Prime allows businesses to create stock items and organise them into stock groups.
Companies can maintain appropriate product classifications for reporting and operational control.
ABC categories can be maintained through a separate classification worksheet or a carefully designed stock grouping structure.
However, stock groups should not be reorganised solely for ABC analysis if doing so would disrupt existing product reporting.
3. Movement Analysis Reports
Movement Analysis reports help businesses examine inventory inflows and outflows.
This information supports the calculation of annual consumption quantities and identification of high-movement products.
For accurate ABC classification, movement quantities should be combined with appropriate unit costs.
4. Reorder Level Management
Tally Prime supports reorder-level information that helps businesses identify products requiring replenishment.
Category A products may need more frequent reorder reviews, while Category C products may use simpler replenishment rules.
Reorder levels should also consider supplier lead time, demand variability and required service levels.
5. Godown-Wise Inventory Tracking
Businesses operating multiple warehouses can monitor stock quantities across godowns.
This improves inventory visibility and helps avoid unnecessary purchases when stock is already available at another location.
6. Stock Ageing Analysis
Stock Ageing reports help identify products that have remained in inventory for extended periods.
This information can be used alongside ABC analysis to identify slow-moving, high-value stock requiring management attention.
7. Excel-Based ABC Classification
Businesses can export relevant stock movement and cost information from Tally Prime to Excel.
The data can then be sorted, calculated and classified using ABC formulas.
Important: Standard Tally Prime inventory reports should not be assumed to provide an automatic, dedicated ABC classification. ABC calculations may require spreadsheet analysis, suitable customisation or additional reporting tools.
Case Study 1: ABC Analysis in an Electrical Wholesale Business
Illustrative case study
A Delhi-based electrical goods distributor managed more than 1,500 inventory items.
The business frequently faced shortages of expensive electrical components while maintaining excess quantities of low-demand accessories.
Management introduced ABC analysis using annual consumption values calculated from inventory records.
Category A products received weekly reviews, Category B products monthly reviews and Category C products periodic verification.
Tally Prime inventory reports supported stock movement analysis and replenishment planning.
After six months, the illustrative results were:
|
Performance indicator
|
Before
|
After
|
|---|
|
Average inventory investment
|
₹50 lakh
|
₹42 lakh
|
|
Inventory holding costs
|
₹4.5 lakh
|
₹3.6 lakh
|
|
High-priority product stockouts per month
|
12
|
4
|
The example demonstrates how improved classification can support more efficient inventory investment.
Case Study 2: ABC Analysis in an Automobile Spare Parts Business
Illustrative case study
An automobile spare parts distributor handled approximately 3,000 products, including engine components, brake assemblies, filters and accessories.
The business struggled with excess slow-moving inventory and delayed replenishment of expensive parts.
Management used ABC analysis to identify high-value products and combined the results with stock ageing and supplier lead-time information.
Tally Prime reports helped monitor stock movements and warehouse balances.
Illustrative results after several months included a reduction in slow-moving stock investment from ₹18 lakh to ₹13 lakh and an improvement in inventory record accuracy from 92% to 98%.
The company also improved purchasing discipline by assigning different review frequencies to each inventory category.
Limitations of ABC Analysis
Although ABC analysis is effective, it should not be the only inventory management technique used by a business.
Its primary limitation is that it focuses on financial value rather than every operational risk.
A low-cost component may be essential for manufacturing an expensive product.
Similarly, products with unpredictable demand, long supplier lead times or strict expiry requirements may need special attention regardless of their ABC category.
Businesses can combine ABC analysis with techniques such as FSN analysis, VED analysis, safety stock planning and inventory ageing reviews.
Best Practices for Successful ABC Inventory Management
Businesses should use reliable inventory records, consistent unit costs and clearly defined classification thresholds.
Category A products should receive closer monitoring and stronger controls, while Category B and C products should be managed according to their value and operational importance.
Inventory classifications should be reviewed regularly rather than treated as permanent.
Most importantly, management should combine financial classification with customer demand, supply risks and practical warehouse requirements.
Conclusion
ABC Analysis in Inventory Management is a valuable technique for improving stock control, working capital utilisation and purchasing efficiency.
By classifying products according to annual consumption value, businesses can identify their most financially important inventory and allocate resources more effectively.
Category A products require close monitoring, Category B products need balanced control and Category C products can generally be managed using simpler procedures.
Tally Prime supports this approach through inventory reports, stock movement analysis, godown management, stock ageing and reorder-level information.
When ABC analysis is combined with accurate accounting records, appropriate stock policies and regular management review, businesses can reduce avoidable inventory expenses and improve product availability.
Successful inventory management is not about maintaining the largest possible stock. It is about maintaining the right products, in the right quantities, at the right time.
Professional Tally Prime Inventory Management Support
Powered by Binarysoft Technologies
Authorized Tally Partner
Binarysoft Technologies helps businesses improve inventory management through Tally Prime implementation, stock configuration, inventory reporting and accounting support.
Location: 1626/33, 1st Floor, Naiwalan, Karol Bagh, New Delhi – 110005, INDIA
Contact us: +91 7428779101, 9205471661
Email us: tally@binarysoft.com
Business Hours: 10:00 AM – 6:00 PM, Monday to Friday
Frequently Asked Questions
What is ABC analysis in inventory management?
ABC analysis is a technique that divides inventory into three categories based on annual consumption value. Category A contains high-value items, Category B contains medium-value items and Category C contains lower-value items.
What is the formula for ABC analysis?
The basic formula is: Annual Consumption Value = Annual Quantity Consumed × Unit Cost. Products are ranked by consumption value, and cumulative percentages are used for classification.
What is the 80/20 rule in ABC analysis?
The 80/20 rule suggests that approximately 20% of inventory items may contribute around 80% of total annual consumption value. Actual percentages depend on the business.
What is the difference between ABC analysis and FSN analysis?
ABC analysis classifies inventory according to annual consumption value. FSN analysis classifies inventory according to movement frequency as fast-moving, slow-moving and non-moving.
CA. Devansh Rathi works closely with wholesalers, distributors, and growing enterprises on taxation, reconciliations, and financial controls. His approach emphasizes accurate records, timely compliance, and efficient accounting systems.