Call CA Tally HelpDesk
+91 9205471661,
7428779101
Introduction: Why Successful Businesses Depend on Better Decisions
Every business owner makes decisions daily.
Should the company purchase additional inventory? Is it the right time to expand operations? Which customers contribute the most revenue? Are rising expenses reducing profitability?
Traditionally, many business decisions depended on experience, assumptions and intuition.
Although experience remains valuable, modern businesses generate enormous amounts of information through sales transactions, accounting records, customer interactions and inventory movements.
The challenge is converting this information into meaningful insights.
Data-driven decision-making enables organizations to use reliable business information, advanced analytics and reporting tools to make informed operational and financial decisions.
Instead of guessing why profits are declining, management can examine sales performance, expenses, outstanding receivables and inventory costs.
For businesses using Tally Prime, financial reports and accounting information can provide a valuable foundation for this approach.
When combined with suitable analytical methods, these records help organizations understand current performance, identify problems and plan future growth.
The real power of business analytics lies not in collecting more information but in using the right information to make better decisions.
1. What Is Data-Driven Decision-Making?
Data-driven decision-making, commonly called DDDM, is the process of using relevant information, analysis and measurable evidence to guide business decisions.
Rather than depending exclusively on personal judgment, organizations examine actual business performance before selecting a course of action.
For example, a retailer considering additional inventory purchases can analyze previous sales, seasonal demand and existing stock levels.
A manufacturing company can examine production costs, material consumption and profitability before changing product prices.
A service provider can review customer payments, operating expenses and revenue trends before expanding its workforce.
Essential Elements of Data-Driven Decisions
Accurate Data: Business records must be reliable and consistently maintained.
Relevant Metrics: Organizations should identify indicators that reflect their objectives.
Analytical Methods: Information must be examined to discover meaningful patterns.
Clear Reporting: Findings should be presented in an understandable format.
Management Action: Insights should lead to practical business decisions.
Performance Monitoring: Organizations should measure whether those decisions produced the intended results.
A successful data-driven approach combines technology, professional judgment and continuous improvement.
2. Understanding Advanced Analytics and Business Reporting
Advanced analytics involves examining business information using statistical methods, forecasting techniques and other analytical approaches.
Business reporting focuses on presenting relevant information through statements, summaries, charts and dashboards.
Although closely related, the two serve different purposes.
Reporting explains what has happened or is currently happening.
Analytics investigates why events occurred, what might happen next and which actions could improve outcomes.
For example, a sales report may show that monthly revenue declined.
Advanced analysis could investigate whether the decline resulted from lower demand, pricing changes, customer losses or inventory shortages.
Together, analytics and reporting help businesses understand both performance and its underlying causes.
Common Business Reporting Areas
-
Sales and revenue performance.
-
Profitability and operating expenses.
-
Customer outstanding balances.
-
Inventory availability and movement.
-
Cash flow and liquidity.
-
Product-wise and category-wise performance.
-
Budget comparisons.
-
Financial trends.
Organizations should select reports according to their business priorities rather than collecting unnecessary information.
3. Four Important Types of Data Analytics
Understanding different analytical approaches helps businesses choose appropriate techniques.
Descriptive Analytics: What Happened?
Descriptive analytics summarizes historical business information.
Examples include monthly sales, annual revenue, total expenses and outstanding customer balances.
It provides a foundation for understanding performance.
Diagnostic Analytics: Why Did It Happen?
Diagnostic analytics investigates the reasons behind changes.
If profit margins decline, management might examine purchase costs, selling prices, discounts and operating expenses.
Predictive Analytics: What Might Happen?
Predictive analytics uses historical information and suitable models to estimate future outcomes.
Businesses may forecast customer demand, cash requirements or seasonal sales.
Forecasts are estimates rather than guarantees.
Prescriptive Analytics: What Should We Do?
Prescriptive analytics evaluates possible actions based on business objectives and constraints.
For example, a company might compare different inventory purchasing strategies to reduce carrying costs while maintaining product availability.
These four approaches provide progressively deeper support for business planning.
4. Why Advanced Analytics Matters for Business Growth
Businesses operating in competitive markets need timely and accurate information.
Advanced analytics can support several important improvements.
Better Financial Visibility
Management can monitor revenue, expenses, profitability and liquidity more effectively.
Improved Cost Control
Detailed expense analysis helps identify unnecessary spending and changing cost patterns.
Stronger Customer Management
Receivables analysis can highlight overdue payments and customers requiring follow-up.
Efficient Inventory Planning
Stock reports help identify slow-moving items, shortages and purchasing requirements.
Improved Strategic Planning
Historical trends and forecasts can support expansion, pricing and investment decisions.
Faster Problem Identification
Regular reporting helps businesses recognize unusual changes before they become larger operational issues.
However, analytics provides the greatest value when underlying data is accurate and management acts on the findings.
5. Essential Business Metrics Every Organization Should Track
Not every business needs hundreds of performance indicators.
A smaller collection of meaningful metrics can provide better visibility.
Revenue Growth
Revenue growth measures changes in sales over a defined period.
Revenue Growth (%) = [(Current Revenue − Previous Revenue) ÷ Previous Revenue] × 100
Gross Profit Margin
Gross profit margin indicates how much revenue remains after deducting the cost of goods sold.
Gross Profit Margin (%) = (Gross Profit ÷ Revenue) × 100
Net Profit Margin
Net profit margin measures profitability after relevant expenses and taxes.
Accounts Receivable
Outstanding receivables show amounts owed by customers.
Ageing analysis helps identify delayed payments.
Inventory Turnover
Inventory turnover indicates how frequently inventory is sold or consumed during a period.
Operating Cash Flow
Operating cash flow helps management understand cash generated or used through regular business activities.
Expense Trends
Comparing expense categories over time can reveal opportunities for better cost management.
The appropriate metrics depend on industry, business size and operational objectives.
6. An Emotional Story: How Better Reporting Helped a Family Business Find Direction
Anil operated a family-owned furniture business in Delhi.
His father had started the company in a small rented workshop, manufacturing wooden tables and chairs for nearby customers.
Over time, the business expanded into a showroom employing skilled workers and serving customers across the city.
Anil was proud of the business his father had built.
However, increasing competition, changing customer preferences and rising material costs began creating financial pressure.
Sales appeared healthy, but cash was frequently unavailable when supplier payments became due.
Anil worked late into the night reviewing invoices and wondering where the money had gone.
He worried about paying employees on time and maintaining the trust of suppliers who had supported his family for years.
One evening, his father noticed his anxiety.
He reminded Anil that running a business required more than working hard. It required understanding where the business was heading.
Anil decided to examine the company's financial information more systematically.
With professional assistance, he reviewed sales trends, customer outstanding balances, inventory movement and product profitability using accounting reports.
The analysis revealed that several products generated substantial revenue but relatively low margins.
Some customers consistently delayed payments, while slow-moving inventory consumed working capital.
Instead of making sudden decisions, Anil introduced gradual changes.
He reviewed purchasing quantities, strengthened payment follow-ups and focused more attention on profitable product categories.
Over the following months, the company developed a clearer understanding of its financial position.
One evening, Anil returned home in time to have dinner with his family.
His father asked whether the business was improving.
Anil smiled and explained that he finally understood the numbers behind the daily operations.
The greatest benefit of better information was not simply higher profitability. It was the confidence to make decisions without constant uncertainty.
This fictional story illustrates how reliable reporting can help business owners protect both financial stability and personal peace of mind.
7. How Tally Prime Supports Data-Driven Decision-Making
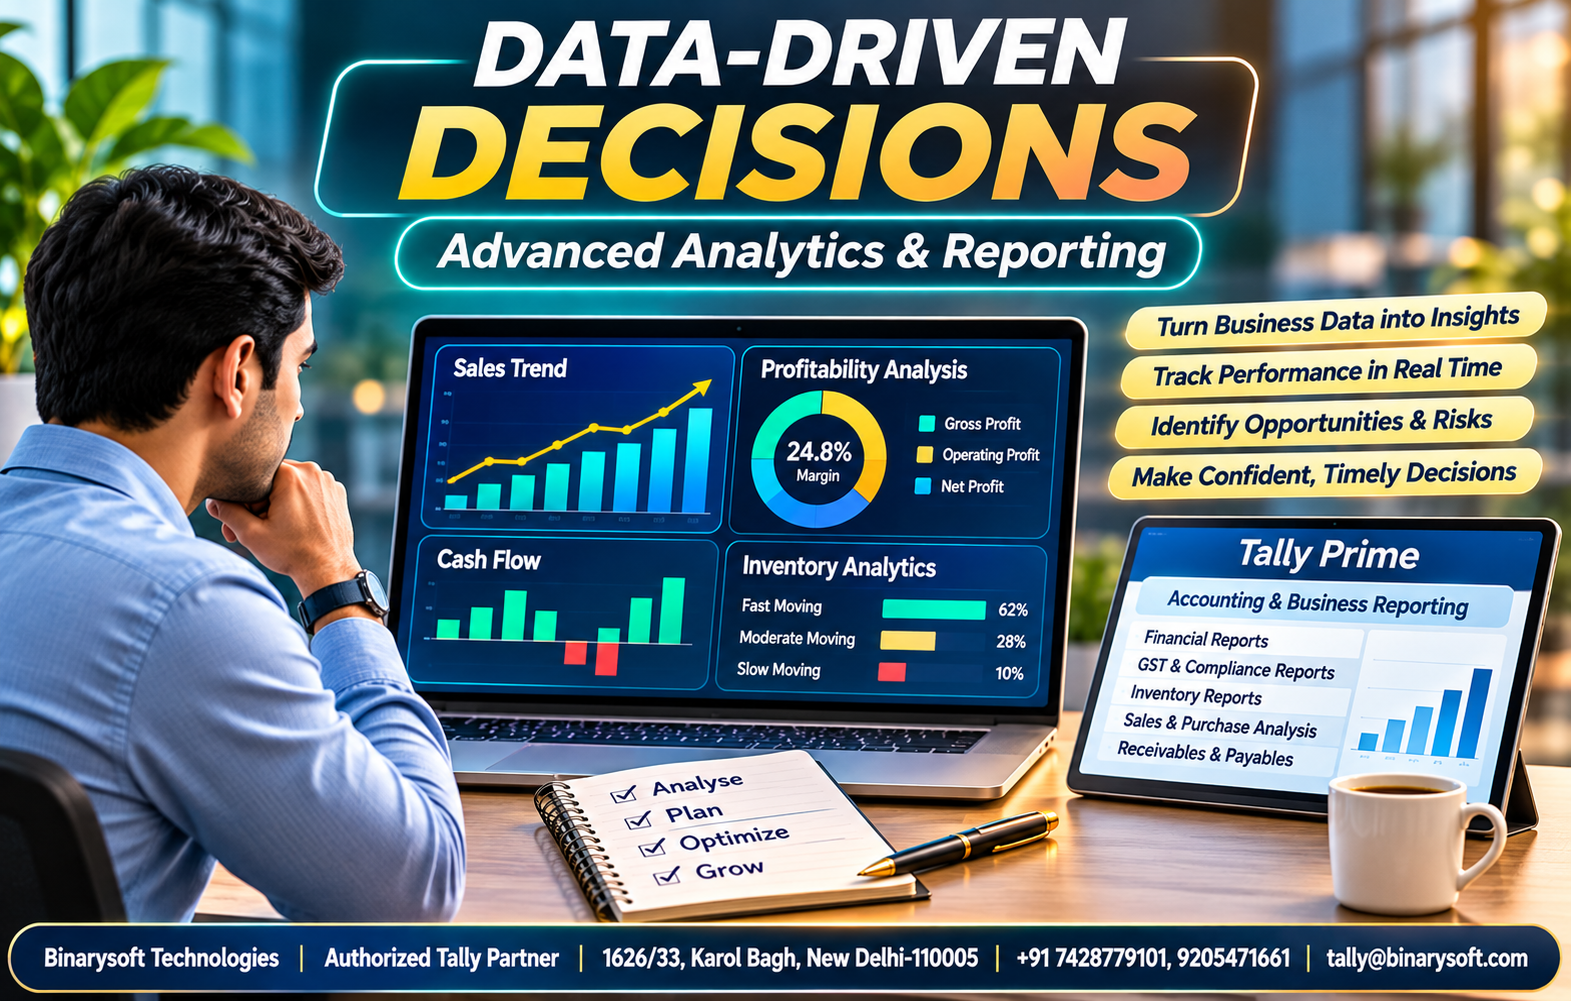
Tally Prime provides accounting, inventory and financial reporting capabilities that can support informed business decisions.
Organizations can use its reports to examine business performance and identify areas requiring attention.
Financial Statements
Tally Prime provides reports such as the Balance Sheet and Profit & Loss Account.
These help management review assets, liabilities, income and expenses.
Cash Flow Reporting
Cash flow information helps businesses understand cash movements and evaluate liquidity.
Receivables and Payables
Outstanding reports help identify amounts due from customers and payments owed to suppliers.
Inventory Reports
Stock summaries and related inventory reports provide information about quantities, values and stock movements.
Sales and Purchase Analysis
Businesses can review transaction information to understand purchasing patterns and revenue performance.
Cost Centre Reporting
When configured appropriately, cost centres help organizations analyze expenses and income across departments, projects or business activities.
Comparative Reporting
Period comparisons help management identify changes in financial performance.
These capabilities make Tally Prime a useful source of structured business information.
8. Using Tally Prime Reports for Practical Business Decisions
Business reporting becomes valuable when information leads to action.
Identifying Profitable Products
Businesses can combine sales, purchase and inventory information to evaluate product performance.
Management can then review pricing, discounts and purchasing strategies.
Managing Outstanding Payments
Receivables reports help identify overdue customer balances.
Companies can prioritize follow-ups and improve credit management.
Controlling Operating Expenses
Expense ledgers and cost centre reports help identify departments or activities with increasing costs.
Improving Stock Planning
Inventory information can support purchasing decisions and help reduce unnecessary stock accumulation.
Monitoring Financial Health
Regular review of profitability, liquidity and liabilities helps management recognize financial risks.
Supporting Expansion Decisions
Historical financial reports can provide useful evidence when evaluating new branches, products or investments.
Advanced forecasting may require additional analytical tools or spreadsheets using approved exports from Tally Prime.
9. Case Study One: Improving Inventory Decisions Through Analytics
Illustrative Case Study
Business Background
A wholesale electrical equipment distributor manages hundreds of inventory items.
The organization uses Tally Prime for accounting, purchases, sales and stock management.
The Challenge
The company frequently purchases excess quantities of certain products while experiencing shortages of faster-moving items.
This creates unnecessary inventory costs and occasional lost sales opportunities.
The Solution
Management introduces a structured monthly inventory review.
The team examines stock summaries, purchase trends, sales history and item-wise performance.
Products are classified according to demand and movement.
The company also evaluates reorder requirements using historical consumption and supplier lead times.
The Outcome
The process provides clearer visibility into purchasing requirements.
Management can make more informed decisions about stock quantities and working capital allocation.
Business Lesson
Inventory analytics helps organizations balance product availability with the financial cost of maintaining stock.
The actual financial impact should be measured using verified operational data.
10. Case Study Two: Strengthening Cash Flow and Customer Credit Management
Illustrative Case Study
Business Background
A manufacturing company supplies products to distributors across several regions.
It maintains accounting records and customer balances in Tally Prime.
The Challenge
Sales revenue is growing, but customer payments are frequently delayed.
Management struggles to estimate available cash for supplier payments and operating expenses.
The Solution
The accounting team begins reviewing receivables ageing, customer-wise outstanding balances and cash flow reports.
Customers are grouped according to payment behavior and agreed credit terms.
Management establishes a regular process for reviewing overdue balances and expected collections.
The Outcome
The organization gains better visibility into outstanding payments and potential cash shortages.
Its finance team can prioritize follow-ups and prepare more informed cash flow projections.
Business Lesson
Revenue growth alone does not guarantee financial stability.
Businesses must also understand payment timing, liquidity and working capital requirements.
11. How to Build a Data-Driven Business Strategy
Organizations can introduce data-driven decision-making through a practical sequence.
Step 1: Define Business Objectives
Identify the decisions that need improvement.
Examples include increasing profitability, reducing overdue payments or improving inventory availability.
Step 2: Identify Relevant Information
Determine which accounting, sales, inventory and operational records are required.
Step 3: Improve Data Accuracy
Review transaction entry procedures, ledger classifications and reporting consistency.
Step 4: Select Performance Indicators
Choose metrics directly connected to business objectives.
Step 5: Establish Reporting Frequency
Prepare daily, weekly or monthly reports according to operational requirements.
Step 6: Analyze Trends
Compare current performance with historical information and approved targets.
Step 7: Make Informed Decisions
Use analytical findings alongside professional experience and operational knowledge.
Step 8: Monitor Results
Evaluate whether the selected actions improve performance.
This continuous process helps organizations develop stronger decision-making practices.
12. Advanced Analytics, AI and Business Intelligence
Modern analytical systems increasingly combine business intelligence with artificial intelligence.
Business intelligence platforms help organizations organize information and present it through dashboards.
AI can assist with identifying patterns, generating explanations and exploring possible future outcomes.
For example, an organization might export authorized accounting reports from Tally Prime into a suitable analytics platform.
The platform could then generate dashboards showing sales trends, expenses and customer balances.
An AI assistant might help summarize those results in understandable language.
However, AI-generated explanations must be checked against the original financial information.
Organizations should also protect confidential records through appropriate access controls and data-handling procedures.
AI should assist financial interpretation, while verified accounting records remain the authoritative source of financial figures.
13. Common Challenges in Data-Driven Decision-Making
Despite its benefits, advanced analytics requires careful implementation.
Poor Data Quality
Incorrect or incomplete records can produce misleading conclusions.
Excessive Information
Too many reports may distract management from important indicators.
Lack of Analytical Skills
Employees may require training to interpret financial and operational information.
Integration Difficulties
Combining information from multiple systems can create technical challenges.
Data Security
Sensitive business records require appropriate protection.
Incorrect Interpretation
Correlation does not always establish causation.
Resistance to Change
Employees accustomed to traditional methods may need time to adopt analytical processes.
Businesses can address these challenges through clear reporting standards, training and regular data validation.
14. The Future of Advanced Analytics and Business Reporting
Business analytics is moving toward more accessible and automated reporting.
Organizations are increasingly exploring interactive dashboards, predictive models and AI-assisted analysis.
These technologies may help businesses identify unusual transactions, anticipate demand and prepare management summaries.
For smaller organizations, the greatest opportunity may come from making better use of information already available in accounting systems.
Rather than immediately investing in complicated platforms, businesses can begin with reliable financial records, meaningful metrics and consistent reporting.
As requirements grow, additional analytical capabilities can be introduced.
The future belongs to organizations that combine dependable information with thoughtful management decisions.
Conclusion
Data-driven decision-making is an essential capability for businesses seeking sustainable growth.
Advanced analytics and reporting help organizations understand financial performance, identify operational challenges and evaluate future opportunities.
By monitoring revenue, expenses, inventory, customer payments and cash flow, management can make decisions based on measurable evidence.
For businesses using Tally Prime, accounting and inventory reports provide a valuable foundation for financial analysis.
Additional analytics platforms can extend these capabilities when more advanced visualization or forecasting is required.
Ultimately, successful analytics depends on accurate records, relevant metrics and management action.
Businesses that understand their numbers are better equipped to protect profitability, strengthen customer relationships and plan confidently for the future.
Powered by Binarysoft Technologies
Authorized Tally Partner
Binarysoft Technologies helps businesses improve accounting efficiency, financial visibility and operational management through Tally Prime solutions, implementation assistance, customization, technical support and cloud-based accounting requirements.
Our focus is to support organizations in maintaining reliable financial information and making better business decisions.
Location:
1626/33, 1st Floor, Naiwalan, Karol Bagh, New Delhi – 110005, INDIA
Contact Us:
+91 7428779101, 9205471661
Email:
tally@binarysoft.com
Business Hours:
10:00 AM – 6:00 PM, Monday to Friday
Frequently Asked Questions
Can Tally Prime support data-driven decisions?
Yes. Tally Prime provides financial, accounting and inventory reports that businesses can use to evaluate performance.
Which Tally Prime reports are useful for management?
Useful reports include the Balance Sheet, Profit & Loss Account, Cash Flow, outstanding receivables and payables, and Stock Summary.
Can AI be used with Tally Prime financial information?
External AI and analytics tools can potentially analyze authorized reports exported from Tally Prime, subject to appropriate safeguards.
What is the biggest benefit of data-driven decision-making?
Its primary benefit is helping organizations make more informed decisions using reliable evidence instead of relying exclusively on assumptions.
CA. Pankaj Bhadoria brings practical experience in GST, accounting, and business process consulting. He works closely with MSMEs to resolve compliance challenges and improve operational transparency. His articles aim to simplify complex regulations for everyday business use.