Call CA Tally HelpDesk
+91 9205471661,
7428779101
What Changed in 2026: Financial Reporting Is Becoming More Data-Driven
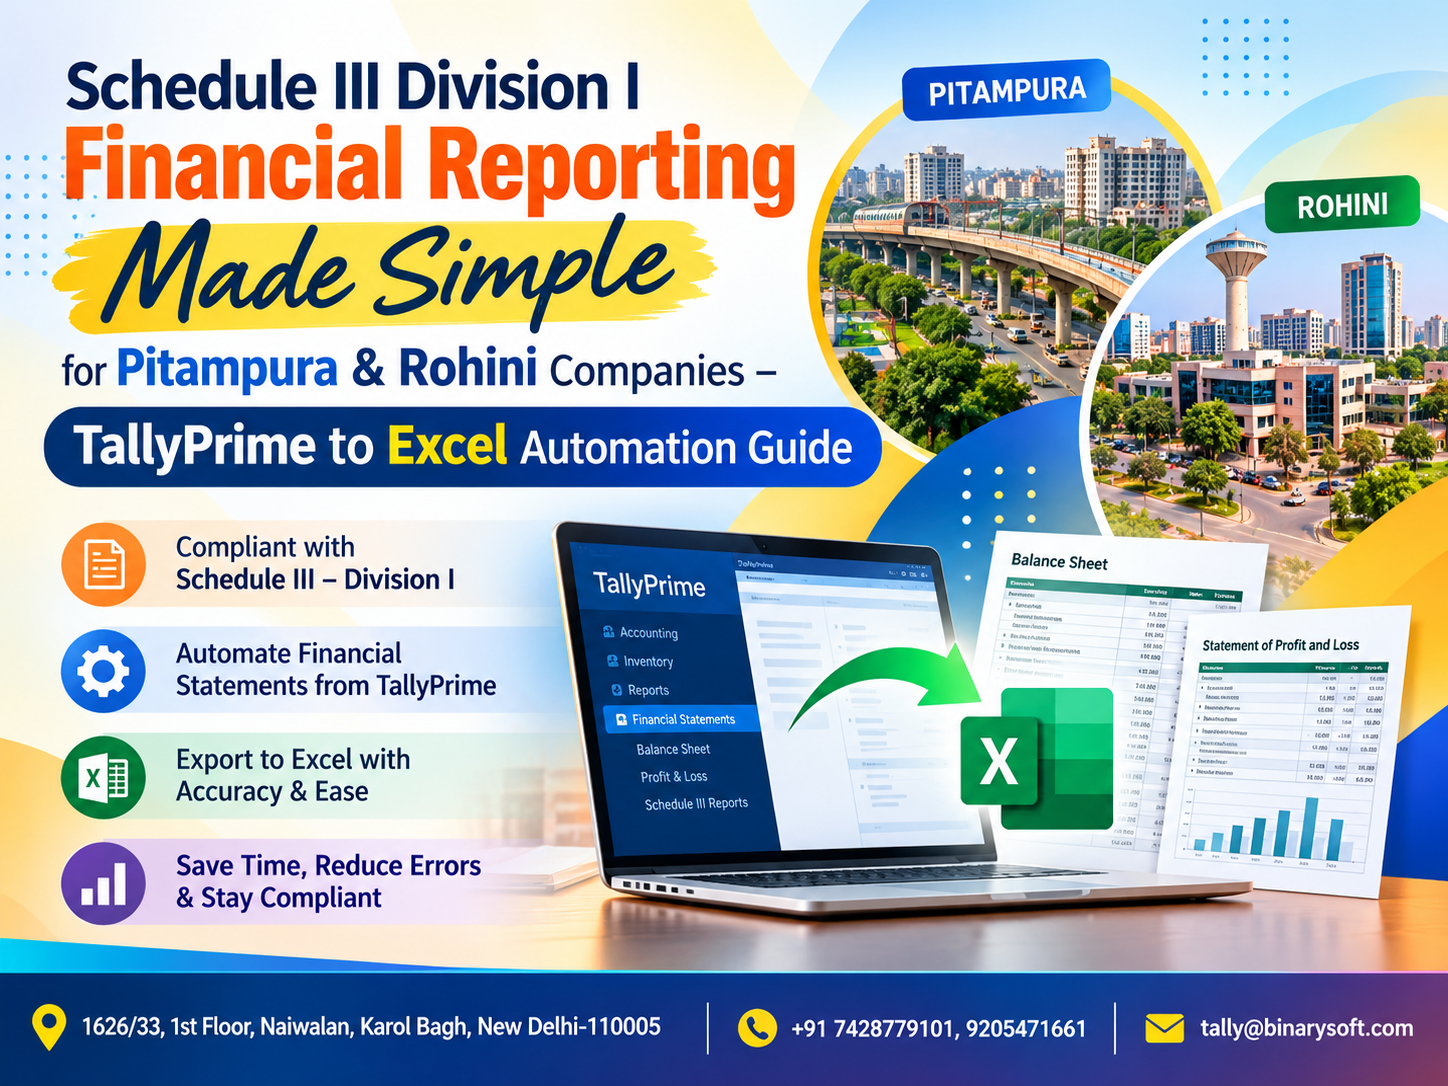
In 2026, companies are under growing pressure to produce financial statements that are not only accurate but also structured, traceable and ready for review without weeks of spreadsheet reworking. For businesses in Pitampura and Rohini preparing financial statements under Schedule III Division I of the Companies Act framework, the challenge often begins after accounting is complete: TallyPrime contains the ledgers and balances, but financial reporting may still require classification, regrouping, note preparation, comparative figures and repeated Excel adjustments. As transaction volumes and reporting expectations increase, manual copy-paste processes create unnecessary pressure during closing and audit periods. A structured TallyPrime-to-Excel automation workflow can simplify this process by converting accounting data into organized reporting schedules, reducing repetitive work and helping finance teams maintain consistency between books, supporting schedules and final financial statements. The benefit is straightforward: faster preparation, better control and fewer avoidable reporting errors.
Understanding Schedule III Division I Financial Reporting
For many finance teams, year-end accounting does not end when the trial balance is ready.
That is often where financial reporting actually begins.
Schedule III Division I provides a presentation framework for financial statements of companies to which that division applies. Preparing financial statements involves much more than taking closing balances from accounting software and placing them into a balance sheet.
A company may need to organize its financial information into appropriate headings and sub-headings, prepare supporting notes, maintain comparative information, review classifications and ensure that the final statements can be traced back to the underlying books.
For companies in Pitampura and Rohini using TallyPrime for day-to-day accounting, Excel frequently becomes the bridge between the accounting database and the final financial statement format.
The problem is that this bridge is often built manually every year.
That creates an opportunity for automation.
Why Schedule III Reporting Can Become Complicated
A trial balance is designed to show ledger balances.
A financial statement is designed to communicate financial position and performance in a prescribed and meaningful presentation.
The two are related, but they are not identical.
Suppose TallyPrime contains hundreds of ledgers such as:
ICICI Bank Current Account
HDFC Bank Account
Trade Debtors – Delhi
Trade Debtors – Outside Delhi
Security Deposit – Office
Advance to Supplier
Director Loan
Term Loan
Office Equipment
Computer Equipment
Professional Charges
Legal Charges
Marketing Expenses
Freight Charges
Employee Benefits
Outstanding Expenses
The financial reporting team cannot necessarily present every ledger individually.
Instead, balances need to be mapped into relevant financial statement categories and supporting notes.
This is where a carefully designed mapping and automation process can save significant time.
A Rohini Finance Manager's Year-End Story
Consider a private company operating from Rohini.
Throughout the year, its accounting team maintained books in TallyPrime. Sales invoices were entered regularly, purchases were recorded, bank transactions were reconciled and expense ledgers were maintained.
The finance manager believed the accounts were well organized.
Then financial statement preparation started.
The auditor requested the trial balance, schedules and supporting details.
The team exported data to Excel.
One employee began copying balances into a financial statement workbook. Another checked whether individual ledgers belonged under current liabilities, trade payables, other current liabilities or another appropriate category. Someone else prepared fixed asset details.
Every change in TallyPrime created another problem.
A ledger balance changed.
The Excel sheet had already been prepared.
Someone had to remember which worksheet contained that number and update it manually.
The finance manager began keeping multiple files:
Final.xlsx
Final_New.xlsx
Final_Revised.xlsx
Final_Audit.xlsx
Final_Audit_2.xlsx
Then one evening, just before a review, a difference appeared between the trial balance and the financial statement workbook.
The difference was not enormous.
But nobody immediately knew where it came from.
The team spent hours checking formulas, rows and manually pasted balances.
The finance manager's frustration was simple:
“If the books are already correct in TallyPrime, why are we spending so much time rebuilding the same numbers in Excel?”
That question led the company to restructure its reporting process.
Instead of manually rebuilding statements every year, it created a controlled workflow:
TallyPrime Data → Standardized Export → Ledger Mapping → Excel Schedules → Validation → Financial Statements
The improvement was not just faster reporting.
The finance manager finally felt that the Excel workbook was connected to the accounting logic instead of being a separate universe of numbers.
What Is Schedule III Division I?
Schedule III to the Companies Act, 2013 sets out requirements relating to the presentation of financial statements for applicable companies.
Division I generally relates to financial statements prepared in accordance with Accounting Standards for companies to which that division applies.
The reporting structure encompasses the presentation of major financial statement components and related notes.
Depending on applicability and circumstances, financial reporting may involve areas such as:
Shareholders' funds
Share capital
Reserves and surplus
Borrowings
Trade payables
Other liabilities
Provisions
Property, plant and equipment
Investments
Inventories
Trade receivables
Cash and cash equivalents
Loans and advances or other relevant classifications
Revenue
Other income
Employee benefit expenses
Finance costs
Depreciation and amortisation
Other expenses
Tax-related items
The exact treatment and disclosure requirements should always be determined based on the applicable law, accounting standards and the company's specific facts.
Automation should support that professional assessment rather than replace it.
TallyPrime to Excel: Why Companies Need a Reporting Bridge
TallyPrime can maintain detailed accounting records, while Excel is commonly used for financial statement schedules, analysis and presentation.
This creates a natural workflow:
TallyPrime
↓
Trial Balance / Ledger Data
↓
Excel Data Layer
↓
Ledger Mapping
↓
Schedule III Reporting Categories
↓
Notes and Schedules
↓
Balance Sheet and Statement of Profit and Loss
Without automation, each stage may involve manual intervention.
With a structured process, much of the repetitive movement and classification of data can be standardized.
The Core Challenge: Ledger Mapping
Ledger mapping is one of the most important parts of financial reporting automation.
A business may have 300, 500 or even thousands of ledgers in TallyPrime.
Schedule III reporting does not require financial statements to simply reproduce the ledger list.
Ledgers therefore need to be associated with appropriate reporting heads.
A mapping table might conceptually contain:
Tally Ledger Name
Tally Group
Schedule III Main Head
Schedule III Sub-Head
Note Number
Current/Non-Current Classification
Debit/Credit Treatment
Reporting Description
Once this mapping structure is established and validated, it can potentially be reused and updated instead of being rebuilt from scratch every year.
Why Mapping Is Better Than Manual Copy-Paste
Imagine a company with 600 ledgers.
With a manual reporting process, someone may review hundreds of balances and decide where each number belongs every time the statements are prepared.
With a mapping-based process, established ledgers can retain their reporting relationships.
New or unmapped ledgers can be highlighted for review.
That changes the finance team's job.
Instead of asking:
“Where does every ledger go?”
the team can focus on:
“Which new or changed ledgers require professional review?”
That is a much more scalable reporting process.
Step 1: Prepare TallyPrime Accounting Data
Automation cannot compensate for poor underlying accounting records.
Before preparing financial statements, the company should review the quality of its books.
This can include checking:
Ledger balances
Voucher completeness
Bank reconciliation
Receivable balances
Payable balances
Inventory records where applicable
Fixed asset ledgers
Loan accounts
Statutory ledgers
Outstanding expenses
Prepaid expenses
Advances
Provision entries
Year-end adjustments
If the accounting data itself is incomplete, an automated Excel workbook may simply reproduce incomplete information more quickly.
Data quality comes first.
Step 2: Export the Trial Balance from TallyPrime
The trial balance can serve as a central source for the financial reporting process.
A structured export should ideally retain information needed for mapping and validation.
Depending on the workflow, this could include:
Ledger Name
Parent Group
Opening Balance
Debit Movement
Credit Movement
Closing Balance
The source export should be preserved before transformations are made.
This provides a reference point for later reconciliation.
Step 3: Create a Master Ledger Mapping Sheet
The master mapping sheet becomes the intelligence layer of the Excel reporting system.
For each TallyPrime ledger, the workbook can store its corresponding financial reporting classification.
For example:
Bank ledgers may be mapped to the appropriate cash/bank reporting category.
Customer ledgers may feed relevant trade receivable schedules where appropriate.
Supplier ledgers may feed trade payable schedules.
Share capital ledgers may be linked to the relevant equity reporting section.
Fixed asset ledgers may feed property, plant and equipment schedules.
Expense ledgers may be associated with the relevant Statement of Profit and Loss categories.
However, mapping should not be based on ledger names alone.
The nature of the balance, contractual terms, accounting treatment and applicable reporting requirements may also need consideration.
Step 4: Identify Unmapped Ledgers Automatically
One particularly useful automation control is an “Unmapped Ledgers” report.
Suppose the previous year had 450 mapped ledgers.
During the current year, the company created 27 new ledgers.
Instead of reviewing all 477 ledgers again, the workbook can highlight those 27 new records.
The finance team can then classify them.
Once approved, those mappings can become part of the master mapping database.
This helps the reporting system improve over time.
Step 5: Build Schedule-Wise Excel Reporting
After mapping, the workbook can aggregate ledger balances into appropriate reporting sections.
Instead of manually typing figures into every schedule, formulas, queries or other controlled Excel processes can draw balances from the mapped data layer.
The result is a reporting structure where changes in source data can flow through the workbook more consistently.
Share Capital Reporting
Share capital requires careful presentation and supporting information.
The reporting process may need to consider details beyond a single ledger balance.
Depending on the company's circumstances and applicable requirements, supporting information may include authorized capital, issued capital, subscribed capital, paid-up capital and other relevant disclosures.
Therefore, not every Schedule III disclosure can be generated from the trial balance alone.
Automation can populate accounting figures, while certain disclosure information may still require a separate master data input.
Reserves and Surplus
Different reserves and accumulated balances should be appropriately classified.
A mapping-based workbook can bring the relevant ledger balances together and help produce supporting schedules.
However, movements during the year may require additional analysis.
This demonstrates an important principle:
Automation can organize data, but financial reporting still requires accounting knowledge.
Borrowings
Borrowings can require careful classification.
The finance team may need information such as the nature of the facility, repayment terms, security and other relevant factors.
A TallyPrime ledger may provide the closing balance, but classification cannot always be determined from the balance alone.
The automation workbook can therefore include additional master fields for reporting decisions.
Trade Payables
Trade payable reporting can become complex when a company has hundreds of supplier accounts.
Instead of manually compiling balances, mapped supplier ledgers can be consolidated into an Excel schedule.
Additional disclosures may require information not directly available from a simple trial balance and should be separately maintained where applicable.
The objective is to automate aggregation without oversimplifying reporting requirements.
Trade Receivables
The same principle applies to customer balances.
A company may have hundreds or thousands of receivable ledgers.
An automated reporting workflow can pull relevant balances into a trade receivable schedule and support further analysis.
Where ageing or other classifications are required, the process may need transaction-level or bill-wise information rather than only closing ledger balances.
This is an important distinction.
Trial balance automation is excellent for statement mapping, but detailed disclosures sometimes require deeper data.
Property, Plant and Equipment
Fixed asset reporting often requires movement schedules.
Typical information can include:
Opening gross carrying amount
Additions
Disposals
Depreciation
Accumulated depreciation
Closing balances
If a company maintains appropriate fixed asset information, Excel automation can help organize the reporting schedule.
However, capitalization dates, useful lives, depreciation policies and other accounting considerations still need professional review.
Inventory
For businesses in Pitampura and Rohini involved in trading, manufacturing or distribution, inventory may represent a significant balance sheet item.
TallyPrime can maintain stock information where inventory accounting is properly configured.
The reporting process may require categories such as raw materials, work-in-progress, finished goods, stock-in-trade or other relevant classifications depending on the business.
A structured export and mapping process can help bring these values into reporting schedules.
Revenue from Operations
Revenue may come from multiple TallyPrime sales ledgers.
For example:
Domestic Sales
Export Sales
Service Revenue
Product Sales
Wholesale Sales
Retail Sales
Online Sales
Instead of manually adding these figures, ledger mapping can group relevant balances under the appropriate financial reporting structure.
The finance team can still retain internal breakdowns for management analysis.
Other Income
Interest income, miscellaneous income and other qualifying balances may need separate classification.
A mapping layer can help distinguish operating revenue from other income, subject to the applicable accounting treatment.
This improves both reporting consistency and analytical clarity.
Employee Benefit Expenses
Businesses may maintain separate ledgers for:
Salaries
Wages
Bonus
Employer contributions
Staff welfare
Other employee-related expenses
Automation can consolidate mapped balances into the relevant reporting category while maintaining detailed supporting schedules.
Finance Costs
Interest and other finance-related costs can be mapped separately from normal operating expenses.
This avoids the common problem of placing every expense into one broad administrative category.
Better classification leads to more meaningful financial statements.
Other Expenses
Other expenses can contain a large number of individual ledgers.
Examples may include:
Rent
Electricity
Professional Fees
Legal Charges
Repairs
Insurance
Printing and Stationery
Travelling
Communication Expenses
Software Expenses
Marketing Expenses
Freight
Office Expenses
A mapping-based workbook can consolidate these automatically while still allowing material items to be presented separately where appropriate.
Comparative Figures: Current Year vs Previous Year
Financial statements commonly require comparative information.
This is another area where Excel automation becomes valuable.
A reporting workbook can maintain separate source tables for:
Current Year Trial Balance
Previous Year Trial Balance
The mapping engine can then apply the same reporting structure to both periods.
This makes it easier to produce comparative columns and identify major movements.
For example:
Particulars | Current Year | Previous Year | Change | Change %
This additional analytical layer can also help management and auditors identify unusual movements requiring explanation.
Automatic Variance Analysis
Suppose professional expenses increased significantly compared with the previous year.
Instead of discovering the change during a final review, an automated workbook can flag material variations earlier.
Finance teams can establish internal thresholds based on percentage or absolute changes.
The purpose is not to decide whether a movement is correct.
It is to identify areas that deserve attention.
The Importance of Control Totals
Every automated reporting system should contain controls.
One of the most important is reconciliation between the source trial balance and mapped reporting data.
The workbook can calculate:
Total Source Debit/Credit or Net Balance
Total Mapped Balance
Unmapped Balance
Difference
Ideally, unexplained differences should not simply be hidden.
They should be visible.
A prominent validation section can show whether all relevant source balances have been accounted for within the reporting structure.
Don't Hard-Code Financial Statement Numbers
Hard-coded figures are one of the biggest weaknesses of many Excel reporting workbooks.
Suppose a finance employee manually types ₹18,75,000 into a financial statement cell.
Later, the TallyPrime ledger changes to ₹18,95,000.
Unless someone remembers to update that particular cell, the financial statement remains outdated.
A better structure links the financial statement to the mapped data.
Source changes can then flow through the workbook according to the established process.
This reduces the risk of forgotten manual updates.
Version Control Matters
Many companies experience the familiar problem of multiple Excel versions:
Accounts_Final.xlsx
Accounts_Final_2.xlsx
Accounts_Revised.xlsx
Accounts_Revised_Final.xlsx
Accounts_Audit_Final.xlsx
Eventually, nobody knows which file contains the latest approved figures.
A controlled reporting workflow should establish clear version management.
The company should know:
Which TallyPrime data export was used
When it was exported
Who prepared the workbook
Who reviewed it
Which adjustments were incorporated
Which version was submitted for review
Automation is most effective when supported by process discipline.
Benefits for Pitampura Companies
Pitampura has a diverse commercial ecosystem including trading businesses, service companies, distributors and professional organizations.
Companies using TallyPrime may already have substantial accounting information available electronically.
The challenge is converting that information into a structured financial reporting format efficiently.
TallyPrime-to-Excel automation can help businesses reduce repetitive year-end work and create a repeatable reporting process.
This can be particularly useful for finance teams that currently depend heavily on manual spreadsheets.
Benefits for Rohini Companies
Rohini businesses can face similar reporting challenges as they grow.
A company that once had 50 ledgers may eventually have 500.
A business with a few customers can grow into an organization managing hundreds of receivable and payable accounts.
Reporting processes should scale alongside the business.
A mapping-driven system can make it easier to accommodate additional ledgers without rebuilding the financial statement workbook from the beginning.
How Automation Changes the Finance Team's Role
The purpose of automation is not to remove accountants from financial reporting.
It changes where their time is spent.
Without automation, finance professionals may spend hours:
Copying numbers
Pasting balances
Adding rows
Checking formulas
Updating repeated figures
Finding broken links
With a structured system, more time can be spent on:
Reviewing classifications
Investigating unusual balances
Understanding variances
Checking disclosures
Reconciling schedules
Analyzing financial performance
That is a better use of professional expertise.
A Practical TallyPrime-to-Excel Automation Structure
A well-designed workbook can contain several controlled sections.
Source Data Sheet – contains imported or exported TallyPrime balances.
Ledger Mapping Sheet – connects Tally ledgers to reporting heads.
Unmapped Ledger Report – identifies new or unidentified accounts.
Master Data Sheet – contains information not available directly from the trial balance.
Current-Year Schedule – aggregates mapped balances.
Previous-Year Schedule – provides comparative information.
Notes to Accounts Working – organizes supporting reporting schedules.
Balance Sheet – draws information from the relevant schedules.
Statement of Profit and Loss – consolidates income and expenses.
Variance Analysis – compares current and previous periods.
Validation Dashboard – identifies differences, missing mappings and other exceptions.
This creates a reporting system rather than a collection of disconnected spreadsheets.
Refresh, Review and Reconcile
A strong automation workflow can follow a simple cycle:
Export
Map
Refresh
Review
Reconcile
Report
When TallyPrime data changes, the source data can be refreshed or replaced according to the established process.
The reporting workbook recalculates mapped balances.
New ledgers appear in the exception list.
The finance team reviews them.
Control totals confirm whether balances are fully accounted for.
The updated financial statements can then be reviewed.
This is significantly more controlled than repeatedly copying and pasting figures.
What Automation Should Not Do
Financial reporting automation should not blindly decide accounting treatment.
It should not automatically assume that a ledger belongs to a particular Schedule III category merely because its name contains a certain word.
For example, a ledger called “Advance” could represent several different economic situations.
A ledger called “Loan” may require analysis before appropriate presentation.
The reporting treatment should depend on facts and applicable accounting requirements.
Therefore, automation should assist professional judgment, not replace it.
Common Mistakes to Avoid
Companies building TallyPrime-to-Excel reporting systems should avoid several common mistakes.
Do not rely entirely on ledger names for classification.
Do not ignore new or unmapped ledgers.
Do not overwrite original TallyPrime exports.
Do not hard-code figures unnecessarily.
Do not combine unrelated reporting categories merely for convenience.
Do not assume that a zero difference automatically means every classification is correct.
Do not use automation as a substitute for accounting review.
Do not forget comparative figures and supporting disclosures.
Do not allow multiple uncontrolled Excel versions to circulate.
And most importantly, do not wait until the final audit deadline to test the reporting workflow.
Why Financial Reporting Automation Is a Long-Term Investment
The biggest benefit may not appear in the first reporting cycle.
The first implementation requires effort.
Ledgers need to be reviewed.
Mappings need to be established.
Schedules need to be designed.
Controls need to be tested.
But once the framework exists, future reporting periods can become significantly more structured.
Instead of rebuilding the entire workbook every year, the company can update the existing framework.
New ledgers can be mapped.
Changed classifications can be reviewed.
Comparative figures can be rolled forward.
The reporting process becomes institutional knowledge rather than knowledge stored in one employee's spreadsheet.
Better Reporting Creates Better Management Visibility
Schedule III reporting is primarily a statutory financial reporting exercise, but the same structured data can also improve internal analysis.
Once ledgers are systematically classified, management can more easily analyze:
Revenue movements
Expense trends
Receivable growth
Payable movements
Borrowing levels
Cash position
Asset additions
Working capital changes
Year-on-year variances
This means the investment in clean accounting data and structured reporting can create value beyond the final financial statements.
From TallyPrime Books to Review-Ready Excel Reporting
The ideal process should not feel like two disconnected accounting systems.
TallyPrime should remain the source for underlying accounting records.
Excel can function as the structured reporting and analytical layer.
The connection between the two should be controlled through exports, mapping, formulas, queries or other appropriate automation mechanisms.
When designed correctly, a figure appearing in a financial statement should be traceable.
Financial Statement
→ Note/Schedule
→ Reporting Head
→ Mapped Ledgers
→ TallyPrime Source Data
That traceability is one of the strongest benefits of a structured reporting workflow.
Conclusion
Schedule III Division I financial reporting can become a demanding exercise when companies depend on manual movement of data between TallyPrime and Excel. The challenge becomes greater as the number of ledgers, transactions, reporting schedules and year-end adjustments increases.
For companies in Pitampura and Rohini, a structured TallyPrime-to-Excel automation workflow can simplify the repetitive parts of financial statement preparation.
The foundation is a reliable ledger mapping system.
Once accounting data is exported from TallyPrime, mapped to appropriate reporting heads and connected with Excel schedules, finance teams can reduce repeated copy-paste work, identify unmapped balances, maintain comparative information and perform stronger validation.
But automation should always operate alongside professional accounting judgment.
The goal is not to make financial reporting automatic without review.
The goal is to make the process controlled, repeatable and easier to verify.
When TallyPrime data, Excel schedules and final financial statements work as one connected reporting process, year-end preparation can move from spreadsheet firefighting to a more organized financial close.
Powered by Binarysoft Technologies
Authorized Tally Partner
Location : 1626/33, 1st Floor, Naiwalan, Karol Bagh, New Delhi – 110005, INDIA
Contact us : +91 7428779101, 9205471661
Email us : tally@binarysoft.com
Working Hours : 10:00 AM – 6:00 PM, Mon–Fri
Frequently Asked Questions
What is Schedule III Division I?
Schedule III Division I provides a financial statement presentation framework for companies to which that division applies and whose financial statements are prepared under the relevant Accounting Standards framework. Applicability and specific disclosure requirements should be checked for each company.
Can TallyPrime data be used for Schedule III financial reporting?
Yes. Accounting balances maintained in TallyPrime can provide an important source for financial statement preparation. The balances normally need to be appropriately classified, mapped and supplemented with other information required for reporting and disclosures.
CA. Yashvardhan Kedia focuses on taxation, business accounting, and compliance management for MSMEs. He helps business owners understand financial information and establish practical processes for maintaining accurate books.